After the FTX fiasco shook the crypto market and made it bleed, the crypto community is abuzz: is Bitcoin going down again? Will it go back up? The ChangeHero team once again collaborated with Crypto Caesar to discuss and provide theories: is the Bitcoin bottom in and where is it?
Crypto Caesar’s Case For A Bitcoin Bottom
Crypto Caesar has 15 years of experience in traditional markets and almost 7 years of experience in crypto. He has a degree in law and economics, a postgraduate degree in law, manages a Bitcoin and Crypto fund, and is the CEO and founder of Crypto Caesar Capital.
Just a week days ago, Bitcoin plummeted to $15,787.53 setting a new low for the year. This was a 77% decline from its high in November 2021. Therefore, the topic of whether Bitcoin has finally found a bottom is a hotly contested debate among the crypto community.
As a trader and long-term investor of Bitcoin all one can do is consider some of the leading indicators to see whether we can reach such a conclusion or not. Or a more reasonable approach might be to consider whether now is a good opportunity to start accumulating Bitcoin.
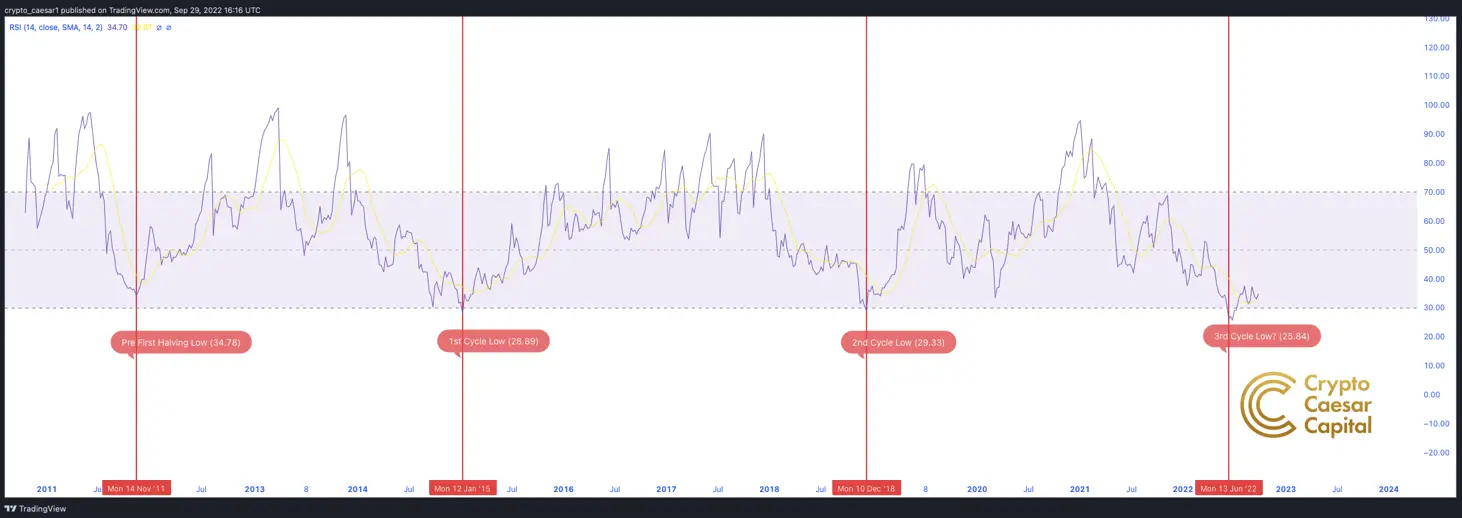
Firstly, the weekly RSI (relative strength index) hit record oversold levels in June this year printing 25.84. In the chart below we can see each RSI level for each previous cycle. It is of note that this is the lowest RSI level ever in Bitcoin’s history. However, one must remember that the RSI can remain oversold or indeed overbought longer than a trader can remain solvent.
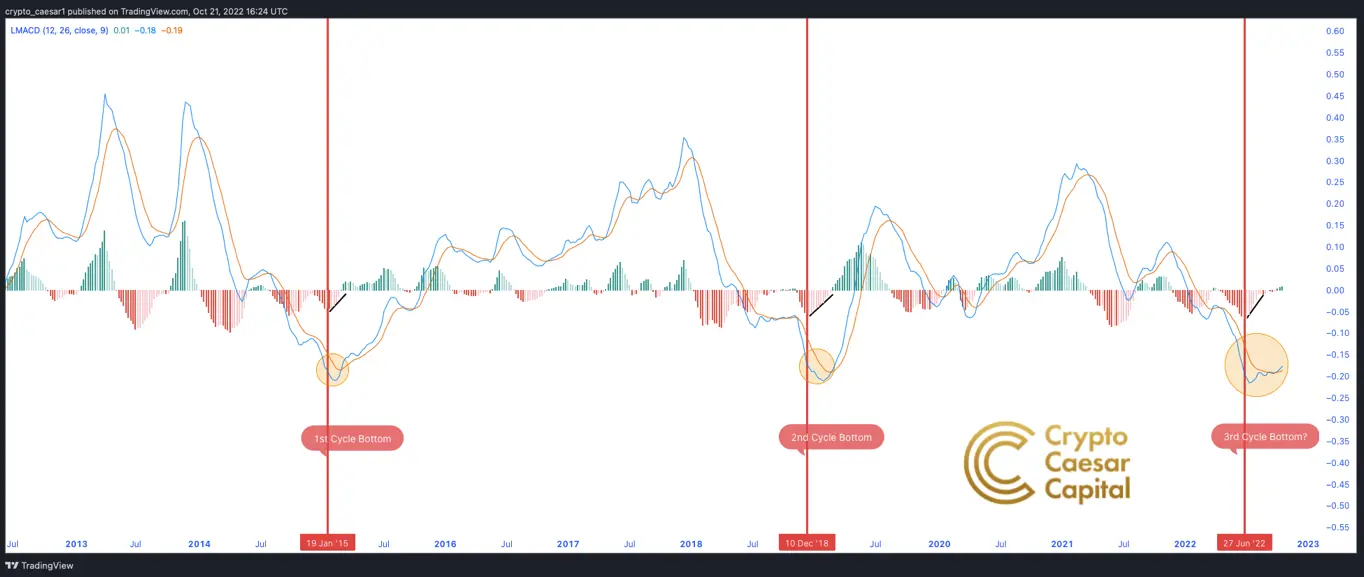
Secondly, the LMACD (moving average convergence/divergence) is bullish. Bearish momentum is waning and the MACD line has crossed and is starting to posture to the upside (see chart). This suggests a ‘potential’ trend reversal.
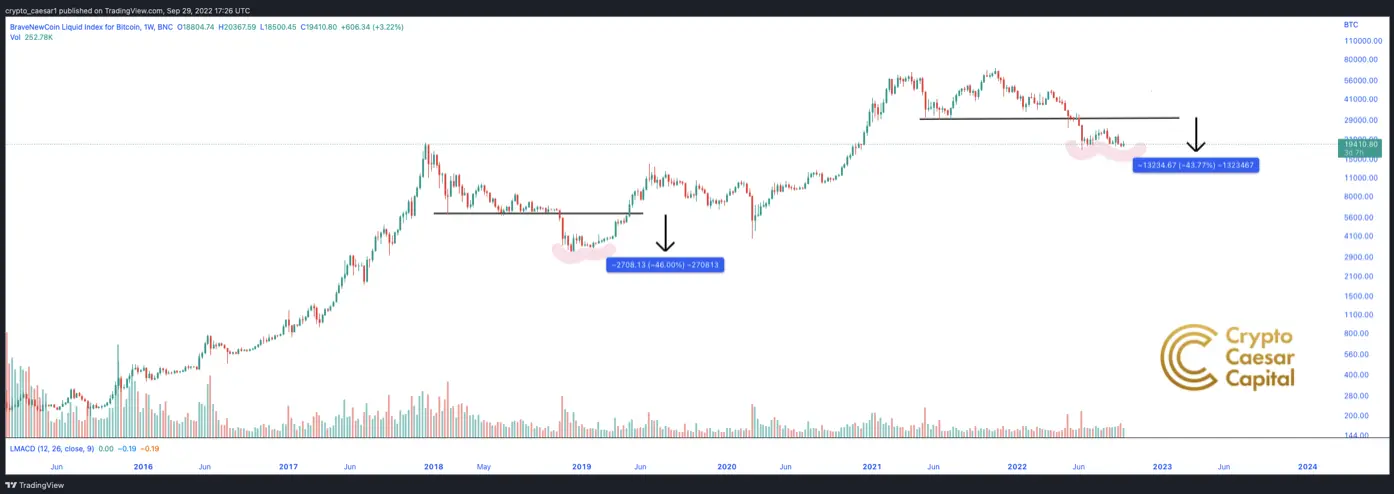
Also, the structure now compared to the 18/19 bottom is undeniably similar (see chart below). For example, the bearish ingulfing candles breaking support to the bottom are very similar in depth (2018 = 46% 2022 = 43.77%). However, there is a lack (in my opinion) of any real capitulation volume in comparison to 2018 & 2015. This is a concern and could be a signal there is more downside to come.
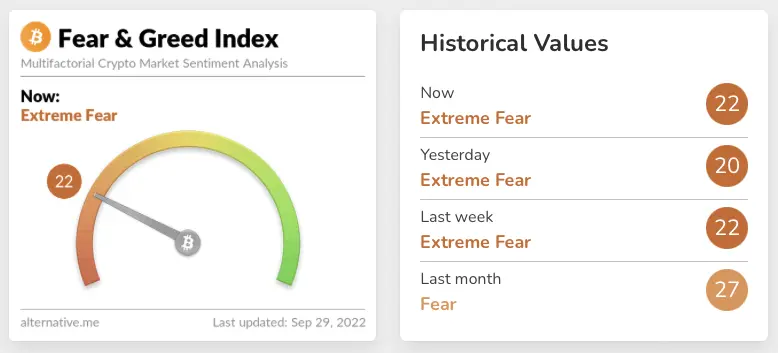
The Fear & Greed Index has been within extreme conditions for months both with Bitcoin and equities (showing sentiment at ATL’s). This is bullish for those investors looking to take advantage of others’ pain and is certainly an indication that this is a level of accumulation, not distribution. From a psychological perspective, one should always be looking to buy the blood even if it’s their own!
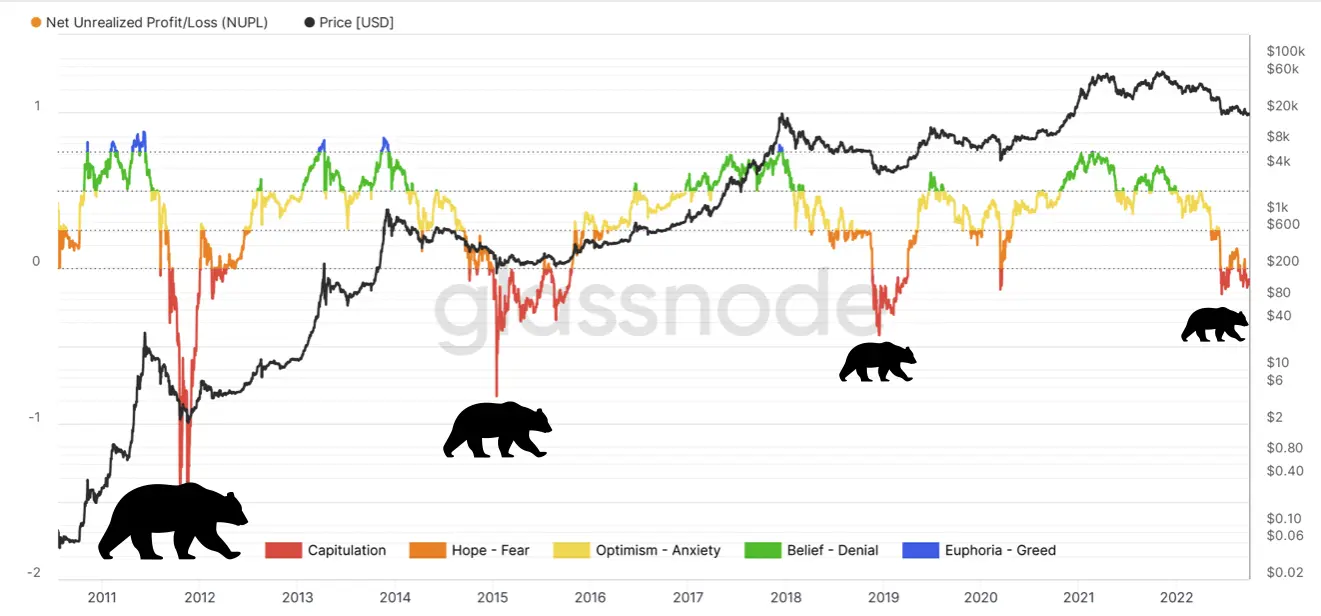
The NUPL (Net Unrealised Profit and Loss) on-chain indicator has historically been able to gauge the tops and bottoms in previous Bitcoin cycles. One can see each previous cycle’s peak and bottom in the chart. This chart indicates that we are in the zone of capitulation. This, in my opinion, is a clear signal to consider accumulating.
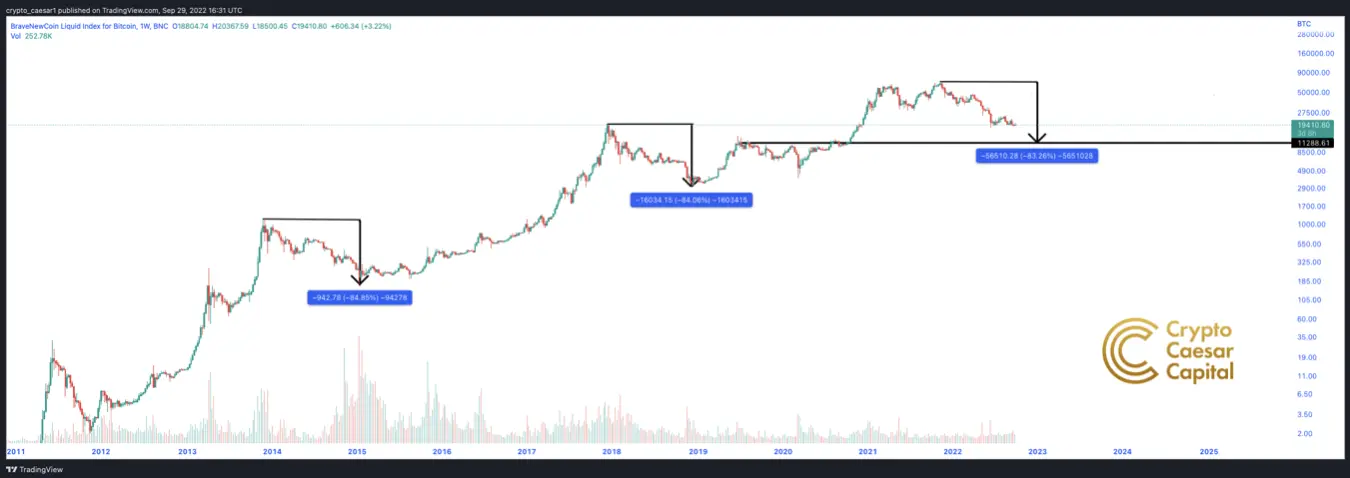
Traditionally, Bitcoin has pulled back 84% into the bear market low from ATH (see chart below). Thus far we have only pulled back 76% from the highs. There has always been clear capitulation volume too, indicating exhaustion of sellers. This is not the case here which indicates possible further downside. However, there is an argument that Bitcoin has matured somewhat as an asset class and the bear market corrections might be less brutal than we have previously experienced.
It is of note that if history repeats and we see an 84% correction that would be in relative terms a further 10% from ATH but in real terms a further 42% from the current price giving Bitcoin a low at 11k.
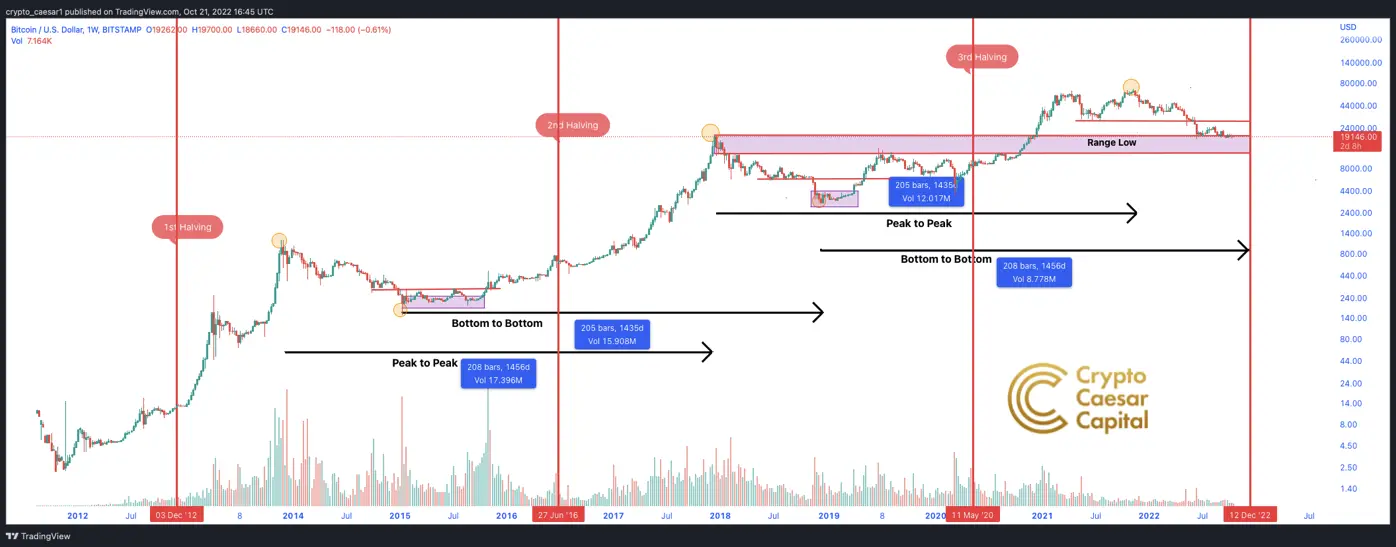
From the first Bitcoin Halving, it is undeniable that Bitcoin has respected a 4-year cycle (see chart). Measured from peak to peak or bottom to bottom each cycle lasts 4 years (give or take a few weeks). As the last cycle low was at the beginning of December 2018 the next cycle low should approximately be December 2022. Cycles can complete early or indeed late. In my experience, it is better to set a window for the cycle high or low. I have set this window as one financial quarter. On that basis, the window opened in October and will close on the last day of December. Therefore, there is still plenty of room for a further low in this cycle.
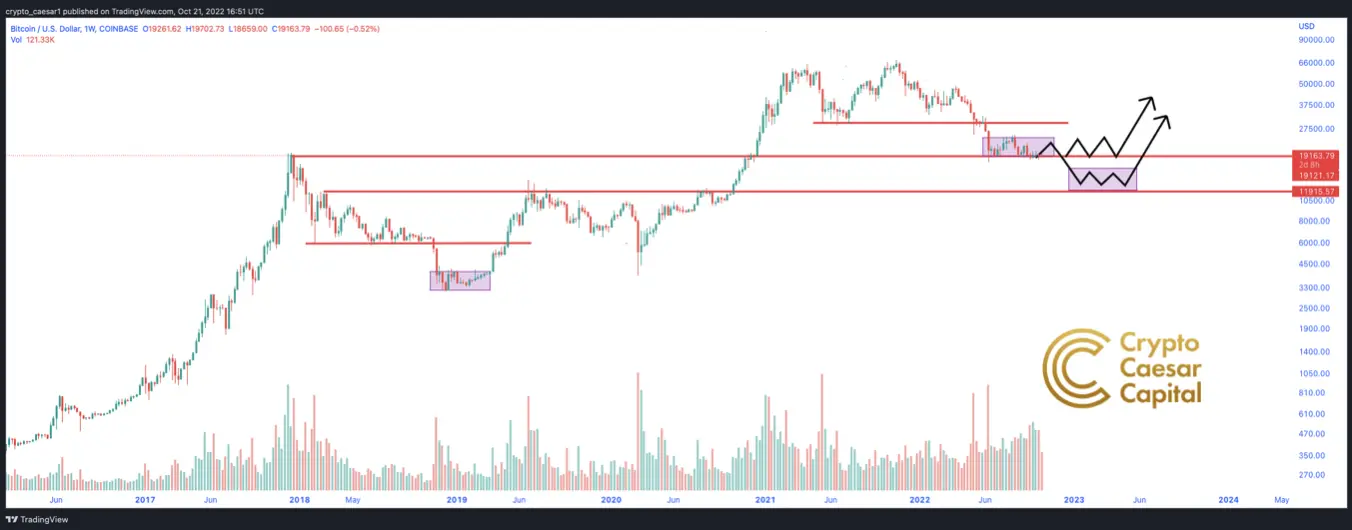
For me, Bitcoin is presenting with two strong possible scenarios. Either we hold this range and finally decide to move out of it (after the accumulation phase ends) or we break down to deeper lows where further accumulation will take place before moving to the upside (see chart). In my opinion, a breakdown can only be seen as an opportunity for the trader/investor.
In conclusion, there are both bullish and bearish cases for Bitcoin in the short term. However, these levels are ones of accumulation, not distribution. In other words, these levels are not for selling and any further correction to the downside should only be seen as a buying opportunity. In my opinion, a six-figure Bitcoin will be achieved in the next bull cycle, therefore, the return is very favourable. Just make sure your time horizon is more than 5 minutes!
ChangeHero Team Weighs In
Alexander, Finance Analyst at ChangeHero
Alexander is responsible for financial analytics in ChangeHero. His insights and regular market updates are highly appreciated by the ChangeHero team and community.
In case BTC fails to hold its current level, then there will be a move to the main support level of $14,000. I suppose that Bitcoin can drop even lower than $14,000 and only after that it would grow. By the end of the year, it is unlikely to be able to grow a lot, because of the global inconvenient situation. I mean the raising inflation in the USA and other countries, the Ukrainian conflict, and some celebrities’ tweets, for example, Elon Musk. All of that negatively influences the BTC growth.
Alex, CMO at ChangeHero
Alex is the head of the marketing department at ChangeHero and is also an experienced crypto trader, who loves to research the market for new gems.
According to my technical analysis, Bitcoin is still within the boundaries of an uptrend channel, and I don’t see any serious reasons to panic. Current support levels within this channel are $15,200, $14,700, and $14,200. I suppose that after such a prolonged flat there may be a drastic decrease to the $11,200 level, but it is unlikely to happen. The main liquidity on the stops is below $17,000 where the price is constantly gravitating. I believe that the exit from the current triangle will be exactly down to the levels mentioned above.
Historically, all three large Bitcoin pumps had two points with buy/sell peaks. We have already passed the first important point in terms of volumes on September 27, when there was a peak in sales. And now the volume chart began to consolidate to the second point, which will fall to the levels I mentioned before.
Speaking about the next bull run, I would say that usually December and January are not profitable months for Bitcoin, so you can expect a pump either in November or February. I am waiting for a breakout to $35,000-40,000 soon and a subsequent retest at $17,000 after, where weak hands will get rid of BTC and wiser will get more. After that, we will see an increase to $100-120k by March or April next year, according to mathematical analysis.
Subscribe And Follow For More
Thanks again to our guest, Crypto Caesar for his valuable input. See more on his Twitter and YouTube, and follow ChangeHero’s blog and social media for more content like this!
Twitter | Facebook | Reddit | Telegram